Studies of Erosion per Boat Trip
comments, additions, questions: webmaster@BoatWakes.org
Summary Page, BoatWakes.org, for key facts
Table of erosion
measured in these studies
Studies of erosion
over time, not
per trip
On this
page:
California, USA
Maryland, USA
Tasmania, Australia
Alaska, USA
In
California, Bauer, Lorang &
Sherman
measured erosion from several types of boat wakes. They took a 7.5m (25') boat
past a cohesive clay/silt bank, at various speeds, and measured the erosion.
The site was on the Georgiana Slough of the Sacramento River near Walnut Grove,
California (38.21N
121.54E), with a "cohesive clay and silt mixture" and a
"bulk density" of 125 lbs/cubic foot.
Their
instruments were sensitive enough to see the sediment washed into the water
from each boat passage, so they can say that their boat on plane at 27 mph,
erodes four thousandths of an inch per passage (shown in table above).
Another
way to look at the erosion is to say that just one boat speeding once for one
mile (2.3 minutes) removes 3.5 square feet of bank (1.7 on each side of the
river), or more than one and a half square feet of bank per minute. In 20
afternoons, 20 boats would remove 1,400 square feet of bank per mile. The
volume of sediment carried downstream depends on wave height and bank height.
If erosion proceeds on a face 6 inches high, including the bank above &
below water level, 700 cubic feet will be carried downstream, or 44 tons.
Even
at slow speed, 7 mph, the same boat would remove a quarter as much bank per
passage as at 27 mph. A
spreadsheet summarizing the results is here.
"Estimating
Boat-Wake-Induced Levee Erosion using Sediment Suspension Measurements,"
(or at ASCE or BL)
by Bernard Bauer, Mark Lorang, and Douglas Sherman July/August 2002,
Journal of Waterway, Port, Coastal, and Ocean Engineering 128(4):152-162
Jean
Ellis, Douglas Sherman, Bernard Bauer, and Jeffrey Hart, "Assessing
the Impact of an Organic Restoration Structure on Boat Wake Energy,"
2002 Journal of Coastal Research special issue 36 pp. 256-265
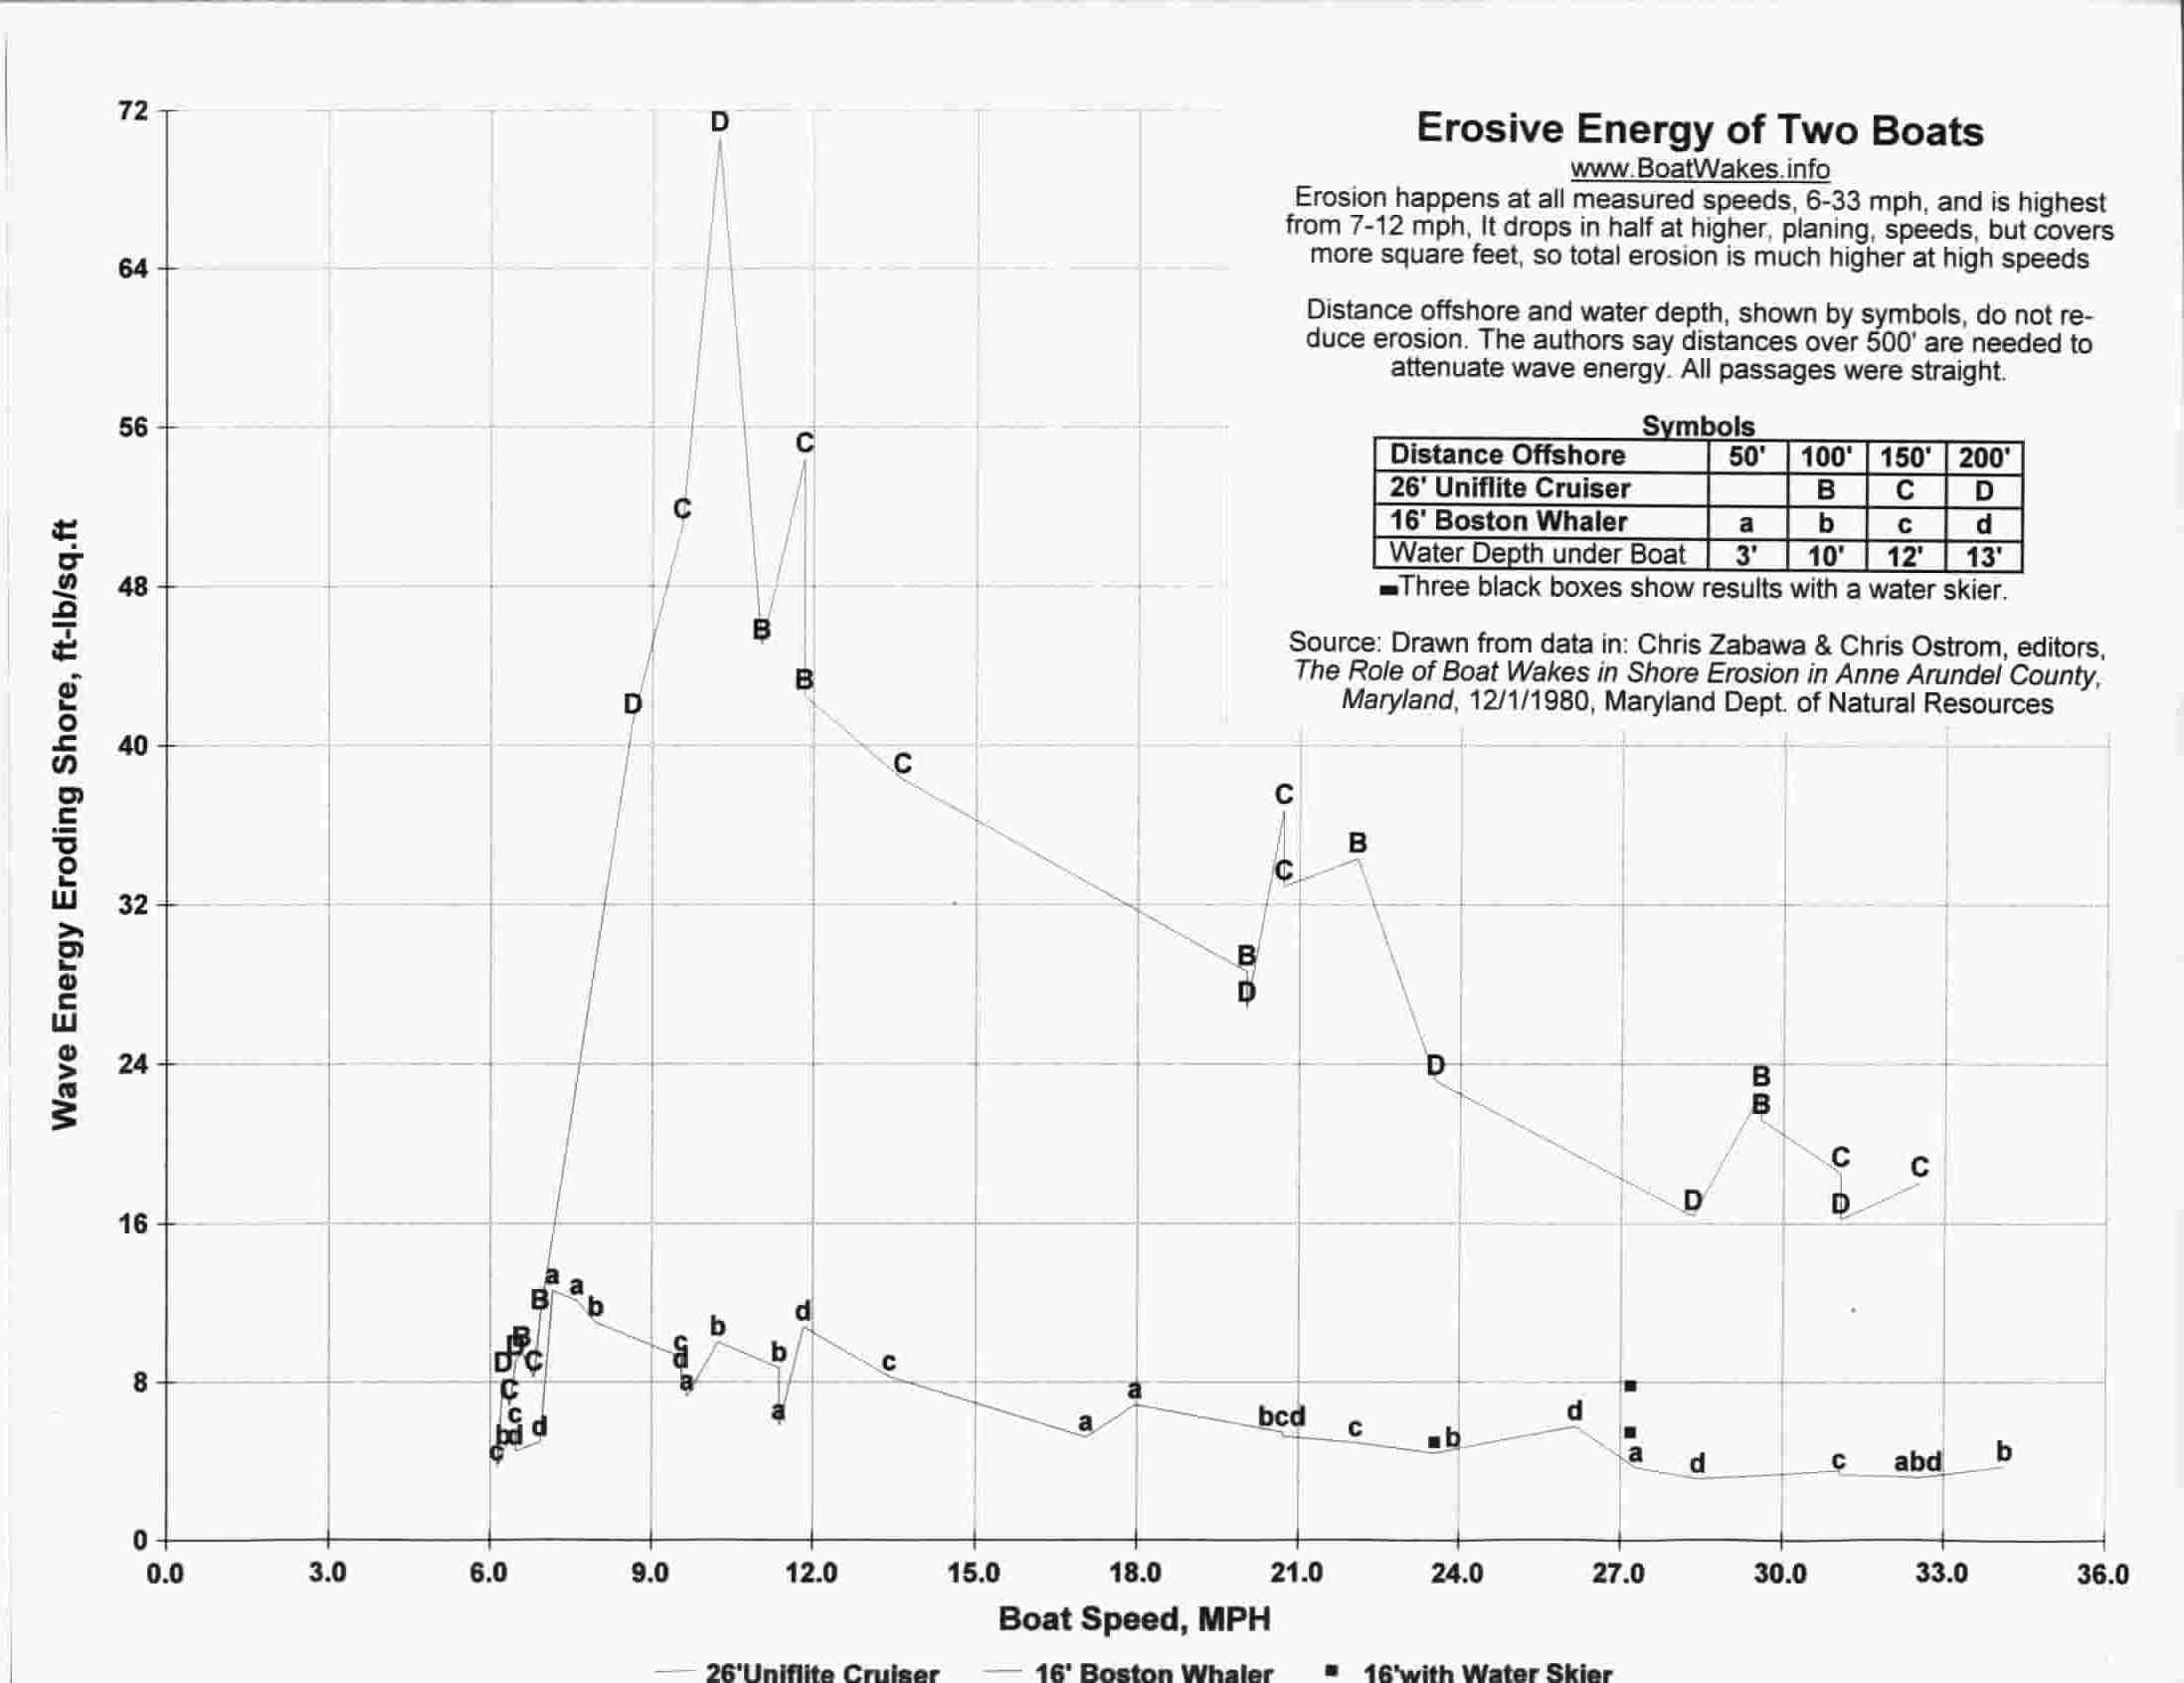
Maryland Dept of Natural Resources sponsored a study, which
shows erosive energy from boat wakes in the Chesapeake Bay (graph & data & full study). They found that total energy from the series of
waves in the wake of one boat does not decline significantly while the wave
travels up to 200 feet across water. Distances over 500 feet were needed to
reduce wave energy.
The
most damaging wave energy came at boat speeds about 10 mph (9 knots) in a 26'
boat, and 7 mph (6 knots) in a 16' boat. They noted these are just above
Maryland's 6 mph speed limit, so a small error in
estimating speed causes maximum wake. The effect of a water skier
ranged from nothing to doubling the wave energy of the boat alone.
At
three spots, near each other (38.96N
76.58W), the shore was eroded 6.8 feet, 5.2 feet and zero feet during one
year (pages 4-46 & 4-47). These three readings average to about a thirteenth of a millimeter of erosion per boat passage (.077mm). These spots averaged 326 boat passages per
day on weekends (95 on weekdays) three quarters of which were 15-25 mph, the
rest split between faster and slower. About half the boats passed 150'-250'
away; a third were closer. Half to 2/3 were pulling water skiers. About half
were less than 16' long; and 90% were less than 26'. (page 6-7) They calculated
72 days at this summer boating level, and a total of 52 days earlier and later
in the season, at half that level, or 16,000 boat passages per year, which
suggests a thirteenth of a millimeter of erosion per boat passage (calculations).
Soils
at the site were sandy. About 90% of each sample by weight were particles of
sand 0.062mm to 2mm; 1-2% was silt .0039 to .063mm; another 1-2% was clay under
.0039, and the remainder was gravel, over 2mm.
Winds
also create waves, but not much erosion. At the three spots mentioned above,
20% of all wave energy came from boats, and it was enough to cause significant
erosion during the boating season. At other spots, where boats created just a
few percent of all wave energy, there was little erosion, except in a major
tropical storm, which suggests that shores have reached equilibrium with normal
wind waves, and boat waves upset that equilibrium.
The
study experimented with boats running 50' to 200' offshore. They measured the
height of the wakes with a gauge about 24 feet out from the shore line, in 2.2
feet of water. Thus they did not measure wave heights or wave energy created at
the boat, but just before arrival on shore, since their goal was to measure
erosive potential on shore. The gauge was a loop of Teflon-coated wire on a
supporting PVC rod. The detector measured changes in capacitance between the
wire and the conducting water as water covered more or less of the wire. Teflon
was used as the insulator, "because of its high resistance to 'wetting' by
films of water that would otherwise delay the response of the gauge in sensing
the rapid fall in water level following the passage of a wave." (p. C-1)
Tricker (p.116) and Nanson (p.6) also discuss measuring wave height by
capacitance.
The
height of the largest wave in each wake, by the time it reached shore, was
indeed related to distance. Closer boat passages (same boat & speed) gave a
higher maximum wave. It appeared that the largest wave in a wake spread its
energy to other waves in the same wake as they traveled over distance, so that
total energy did not fall off, but the height of the largest wave did. This
observation is consistent with theory in Doctors (2002 p.30,
bottom line of each graph), where calculated wave heights decrease slowly
with distance, but total calculated wave energy (sum of squares of heights) is
constant in the full range where it was estimated (up to 1300 feet or 400
meters).
They
also measured that their 26' boat, passing 200' offshore at 21 knots, caused suspended sediments at the shore to rise from 5
parts per million (milligrams/liter) to 440 parts per million in the first wave,
and then drop to 330 parts per million after 10 passes, presumably reflecting
suspended sediment being carried out of the sampling area by currents and
waves.
Final Report on the Role of Boat Wakes in Shore Erosion in Anne Arundel County, MD, edited by Chris Zabawa & Chris Ostrom
12/1/1980 for Coastal Resources Division, Tidewater Administration, MD Dept of
Natural Resources, Annapolis:
Chapters 1-3 (2mbytes)
Intro & Site Selection
Chapter 4 (6mbytes)
Descriptions of Main Measurement Sites
Chapters 5-6 (2mbytes)
Backup Sites, & All Measurements
Chapters 7-8 (1mbyte) Wind
Waves, & Boat Wake Energy Varying with Speed, Distance, & Boat Size
Chapters 9-10 &
Appendices (1mbyte) Recommendations, Wave Formulas, Gauge Design
The following summaries were prepared from data in the report
spreadsheet of data
from individual boat wake experiments & graph of erosive
energy by speed, distance & boat size
Tasmania has a graph
of erosion related to boat speed and wave type. It does not show numbers,
but it shows a pattern of much higher erosion at planing speeds than slow
speeds. They also say slow speeds need to be below 4 or 5 knots. They warn that
many parts of their World Heritage area are off
limits to power boats, and recommend in other areas that boaters educate
themselves by periodically standing on the shore, watching it erode as power
boats go by.
Their
major study
reports on the Gordon River in Tasmania (42.54S
145.72E), which is so beautiful that tour boats take 110,000 visitors per
year. For thousands of years the river has deposited more sediment than it took
away, burying old riverbeds, which can still be found in excavations. That
growth has now reversed. The commercial tour boats (there are very few
individual boats) have caused major erosion of the riverbanks.
The tours are popular,
because they take visitors right into a wilderness area with "mist covered rainforest reflected in perfectly still
waters" (p.14). Platypuses live in the banks; rare kingfishers, parrots,
hawks, and black swans live there. Banks have built up along the river over
thousands of years, with swamps and lakes behind them which are home to rare
ecosystems: shallow lakes whose waters do not mix (meromictic lakes). Erosion
before 1989 was rapidly threatening to breach the banks and wash out these
protected lakes.
"By 1986, continuous stretches of river bank up to
several hundred metres in length had collapsed into the river, taking with them
Huon pine and Myrtle trees up to 20 metres in height." (p.18) In 1989 three quarters of
the river was closed to commercial traffic, and a speed limit of 9 knots was
imposed on the lower part, which remained open. By 1994 erosion continued, so
the speed limit was reduced to 6 knots for commercial boats. Erosion has slowed
but still continues, so Tasmania is looking into limiting the size of wakes
directly, rather than just speed. They expect tour operators eventually to use
boats designed for low wakes, or the tours will have to stop. The present
erosion carries off every year what took 10-100 years to deposit. Even wakes 20
mm high (.8 inches) cause erosion, so any significant boat access may be
unsustainable. "After a trial period it has always been found necessary to
introduce further restrictions." (p.19) The only sustainable level is considered
to be zero wake-induced erosion.
In some areas with well-protected banks, aircraft
landings have been allowed on the river, but they destroy the quiet wilderness
experience for others, and they still cause erosion. Water skiing and jet-skis
are prohibited on the entire river. Non-motorized boats have not been
restricted so far.
"…some 80% of the
total bank length of the lower Gordon River is affected by erosion and cruise
vessels are considered to be the major erosive agents.
"In natural fluvial systems erosion is expected to be concentrated on the outside bank at bends in the river channel, while inside bends are often depositional areas. However, the erosion on the lower Gordon River is generally more severe on the inside bank of bends where wash waves are concentrated by compression of the wave train generated by the turning vessel and by boats tending to cut corners and travel closer to the inside banks. In 1987 University of Wollongong consultants concluded that the bank erosion was almost entirely due to boat-generated waves and that the (then) recently introduced high speed tourist launches had accelerated and spread the problem. This hypothesis has been strongly supported by subsequent investigations and regular erosion monitoring.
"The effect of waves
generated by river traffic is significantly different to that of naturally
occurring wind driven waves. The size of wind waves is proportional to wind
speed and fetch, with wind driven waves tending to travel along the relatively
straight reaches with greatest fetch. Whilst large waves may commonly occur
towards the centre of the channel they do not travel into the more sheltered
nearshore waters except at the ends of reaches. Relatively few stretches of
bank are therefore subject to direct attack from large wind driven waves. Wash
waves are generated in mid channel and approach most areas of bank, including
those not normally affected by wind waves, at a greater angle than naturally
occurring waves " (p.19)
In
1998 they estimated 100mm of erosion per year in the lower river, open to
commercial traffic with speed limits. (They actually measured 10 mm/year
erosion, but they believed that was underestimated by a factor of about 10,
since the most eroded areas were inaccessible undercuts, so measurements were
made on more resistant areas.) In 2006 they roughly estimate about 20% as much
erosion, 20 mm/year, because of better hull designs (catamarans) and speed
limits (email).
An update
published in 2005 used a turbidity meter to count boat passages. The amount
of turbidity (cloudiness from suspended sediment in the water) indicates the
erosion caused by each passage. 82% of the suspended sediment was caused by
commercial tour vessels, which therefore needed lower speed limits or better
hull shapes. The other 28% was caused by fishermen (especially when they went
fast at dawn or dusk to get to or from fishing areas) and individual tourists.
These boats carry far less than 28% of the visitors, so their effect is
disproportionate, and they also need speed limits.
This
turbidity monitoring provided an estimate of about 1600 boat passages per year,
or .0125mm erosion per boat passage (20mm/1600). (This is consistent with the
110,000 visitors per year and boat sizes (up to 250 passengers), since 1600
boat passages would mean 800 round trips at an average of 140 passengers per
trip.) The estimate of erosion is lower than in California at 7mph, though the
boats are much larger, but it is very much an estimate (estimated number of
passages, estimated under-measurement of erosion), not as carefully measured as
the California studies, and in any case the shore materials are likely to be
different.
River
banks were eroded at the water's edge, so many have become very steep, and
undercut (a common pattern). It is very hard to establish protective vegetation
on these steep and undercut surfaces.
An early
experiment in Tasmania has similar methodology to Alaska's, though with
bigger boats Three tour boats (35-60 tons) went past a sandy shore repeatedly,
at different speeds to generate different waves. Nanson et al (p.5) measured
wave height in 3m of water, 21 m from the bank. Boats steered by a buoy 15 m
farther out than the wave probe, 36m from the bank, in water 6m deep (p.6).
Waves were measured by a capacitance probe and by videotaping the water level
against a surveyor's staff.
Erosion
pins (2 x 200mm) were placed in the shore. They were removed, the bank was
smoothed with a spade, and the pins were replaced after each passage, though
they note that placement of pins disturbs the ground (p.6).
They
also pinned a pan in the water (at unknown depth or distance offshore) to catch
some of the disturbed sediment (27 x 30 x 2cm, with a 1.5 x 1.5cm mesh placed
1.5cm from bottom to help keep sediment in place, though they saw that waves
late in each wake did wash out some sediment which had collected earlier from
the same wake). They took a grab sample of water 30 cm above the bottom
(unknown depth & distance offshore), to measure sediment in the upper
water. These two sediment measurements had high variability and did not seem as
useful as the erosion pins.
Period
was measured as the total time for each wave train, divided by the number of
crests in the train. Wave length in meters was calculated as 1.56[period]2
Maximum
wave height was measured from maximum crest to the preceding trough. Its power
was calculated by a formula on the formulas page.
Significant wave height was the average of the highest third of waves in a wave
train. Their power was multiplied by the number of significant crests in the
wave train (1/3 of total) as a proxy for total energy in the wave. (Maryland
calculated energy of each wave, which may be more accurate, since energy is a
non-linear function of wave heights.)
The
best correlation of erosion was with the total power of significant waves, 93%.
The correlation of erosion with height of the biggest wave was 73% (not
statistically significant difference, for this sample size, p.12). Waves of 5
cm eroded 2-3mm of bank; and erosion rose steadily with wave height; 35cm waves
eroded 20 mm of bank. A few much larger waves, up to 55 cm, eroded 40-70mm of
bank. These experimental results were far higher than the average found for a
year elsewhere on the river (0.06mm/boat passage). Part of the reason is that
the experiment was done at an atypical shore of very loose sand, to identify
differences with different types of waves. Most of the shores are cohesive
clay.
Speed
limits therefore had substantial effect in reducing bank erosion (p.11).
Erosion was 100cm/year from 1983-87, when speeds were 45-55kph and resulting
waves were 50-100cm. Erosion dropped to 30cm/yr February-May 1987, when boats
were restricted to 17 kph, with waves 30-50cm. Erosion dropped further to
6cm/yr from June 1987-June 1988 when boats were limited to waves < 30cm, and
one trip per day, still at 17kph.
Lower
Gordon River Recreation Zone Plan A subsidiary document to the Tasmanian Wilderness
World Heritage Area Management Plan, 11/98, Tasmania Parks and Wildlife
Service, A division of the Department of Primary Industries, Water and
Environment, ISBN: 0 7246 6221 9
"Lower
Gordon River turbidity monitoring April 2003 – December 2004," by Jason Bradbury 8/5/05,
Tasmania Department of Primary Industries, Water and Environment, Resource
Management and Conservation Division
Gerald
Nanson, Axel von Krusenstierna, Edward Bryant, and Martin Renilson,
"Experimental Measurements of River-bank Erosion Caused by Boat-generated
Waves on the Gordon River, Tasmania," 1994 Regulated Rivers:
Research and Management 9:1-14
Alaska Dept of Fish & Game cooperated with the US
Geological Survey to measure erosion and the highest wave in each boat wake at
several spots in 1996 on the Kenai River in south central Alaska (60.5N
151W). They were concerned because of decades of measurements of erosion.
Sediments, which erode into the river because of fishing boat wakes, threatened
the salmon which the boats were there to fish.
They,
like Tasmania, point out that natural river currents generally erode the
outside of curves in rivers and deposit sediment on the inside of bends. They
found unnatural semicircular pockets of water eroded on the inside of bends, up
to 14 feet in diameter. They observed these being eroded by successive boat
wakes.
Motorboats
are prohibited on part of the upper river, and are limited to 35 horsepower on
the lower 50 miles. The banks sometimes have cohesive clay rich tills, and
sometimes non-cohesive outwash alluvium from glaciers.
For
measuring erosion, they drove smooth steel rods horizontally into the banks.
The rods ("pins") were generally 3/8 inch diameter by 36 inches
(9.5mm x 91cm). Because of accessibility they were placed too high in the banks
to measure undercuts at the water level, which seem to have been the largest
form of erosion, as in Tasmania. In fact one pin was lost when four feet of
bank slumped into an undercut, showing the need for very long pins or other
methods to measure large losses. If only small losses are measured, the average
loss will be seriously underestimated.
|
|
inches |
|
mm |
|
|||
|
Site |
Erosion measured by pins |
Undercuts |
Boat passes |
Erosion/pass, average in
undercuts |
Sediments |
||
|
|
maximum |
average |
maximum |
average |
|
|
predominant size from
graph |
|
Soldotna |
2.5 |
1.0 |
17 |
13 |
2,200 |
0.15 |
0.1
to 0.2mm, fine-grained non-cohesive (p.38) |
|
Kenai
Keys |
31.5 |
15.3 |
12 |
12 |
11,000 |
0.03 |
0.3
to 30mm |
|
RW
Camp |
0.75 |
0.3 |
45 |
9 |
22,000 |
0.01 |
0.1
to 0.3mm |
For
measuring wakes they used a float connected to a pen on paper slowly advancing
(1.5 inches per hour, p.15) so all the waves from one wake were superimposed on
the paper, and only the maximum wave could be discerned. The floats were close
to the bank. In one case (Kenai Keys) the float was in front of a vertical wood
retaining wall, where it might measure the combination of original waves and
waves reflected off the wall. It was typical for boats to power upstream and
float with current downstream, so only the powered passages caused wakes and
were counted. Each of the three wake gages malfunctioned and did not record
data for major parts of the summer. The authors used parallels in river usage
between sites to estimate boat passages when gages were not working.
They
also measured sediment which was suspended by a wake and which settled in a pan
12" x 18" x 2" deep (30.5cm x 45.7cm x 5.1cm) "pinned to the
river bottom near the base of the streambank." (p.19) They did not say
exactly how far it was from the bank, how long was allowed for settling, nor
how the contents were prepared for weighing. They also bottled water samples in
a "submerged bottle" (no details of location or timing), so they
recognized that fine sediments would stay suspended and needed to be sampled in
the bottle. The quantities of sediment collected by both methods were highly
variable for given wave heights, but the maximum did rise with increasing wave
heights.
The
smallest waves they observed (0.18 feet or 2.16 inches or 55mm) still caused
erosion, as measured by presence of sediment in the collection pan. From this
size wake they measured 0.03 pounds (0.48 ounces or 14g) of sediment in the
pan, which collected part of the erosion from about 1 foot of bank (30.5cm). At
a density of 125 pounds/cubic foot (Bauer, since Alaska did not provide data),
this is 0.4mm deep on a face 0.18 feet high by 1 foot wide. This is a
substantial underestimate, because the pan would not collect all sediment
raised from 1 linear foot of bank. The experimental area thus seems more
erodible or otherwise different from the average shown in the table above.
The
largest erosion they measured in the pan was 1.35 pounds from a wake .91 feet
high, which would represent erosion 3.6 mm deep.
They
compare tractive energy when the river current pulls sediment off the
streambanks, and wake energy against the streambanks, and identify that wake
energy is much larger. (They do not assume all the current's energy goes to
erosion, but they may assume all wake energy does, when some may go to
turbulence (heat)?)
Bank
protection methods (anchored tree trunks, willows, wood & stone walls) all
worked to prevent erosion behind them. One set of anchored tree trunks broke
loose, and others would rot, so they need periodic maintenance. Anchored trees
have the benefit of trapping sediment and protecting fish, but when they break
loose they can cause blockage and higher flood waters downstream. One wood
barrier was simply a wide board attached to a tree trunk at the annual high
water mark, to prevent erosion at that height. The descriptions do not have
enough detail, variety of locations, or length of observation to give strong results
on advantages of each method.
Effects
of boatwakes on streambank erosion, Kenai River, Alaska, Dorava, J.M., and
Moore, G.W., 1997, U.S. Geological Survey Water-Resources Investigations Report
97-4105, 84 p.